Average Churn Rate in SaaS
How much churn is OK and how much is not? What are the SaaS churn rate benchmarks? Is my SaaS within the average range? Find the answers below.
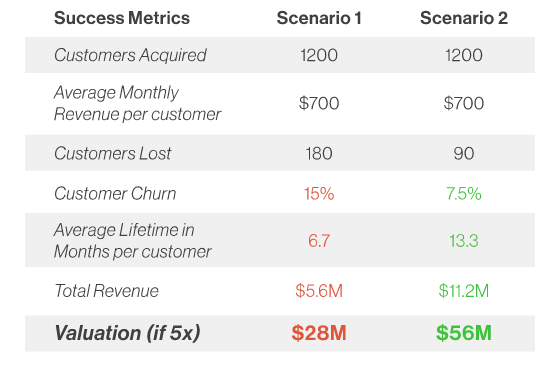
There’s two approaches to growing your SaaS. The first one is focusing on customer acquisition and the second is customer retention. Decreasing churn means longer retention and higher Customer Life Time Value (LTV), which, for us marketers, means more money for acquisition, which means more customers and so on.
This post will be solely about churn, the differences between monthly churn, annual churn, user churn or revenue churn and benchmarks. If you’re interested in articles on customer acquisition, check out my 99 Best SaaS Growth Hacks post, Growing SaaS by building social proof or SaaS Marketing on Quora posts.
Calculating Churn
Before we dive into the actual Churn benchmarks, let’s see the most common approaches to calculating churn rate. The easiest calculation would be your annual churn which is measured over a period of 12 months. If you have 1000 customers and 40 leave, you have a 4% annual churn.
1000x0.96 = 960
Monthly Churn Rate
A far more comprehensive and valuable metric is your monthly churn rate. It takes in account changes made during the year as you will have customers leaving continuously (unless you have everyone locked in for an annual contract).
If we use the same example, a 4% annual churn rate would mean a 0.34% monthly churn rate. And I do not know any business with that kind of churn rate, not even below 2%.
Formula for calculating monthly churn rate
Monthly Churn Rate = 1 - (1 - Annual Churn Rate)1/12
0.34% = 1 - (1 - 0.04)1/12
So yes, next time you see someone reporting on their average churn rate, chances are they mean the monthly churn rate.
Average Monthly Churn Rate
Let’s reverse it now, say you have a 4% monthly churn rate, what would your annual churn rate look like?
=(1-.04) ^ 12 = 0.61
By substracting from 100, you will get your annual churn rate = 100 - 0.61 = 39%.
- 4% Annual Churn Rate is only 0.34% Monthly Churn Rate
- 4% Monthly Churn Rate is 39% Annual Churn Rate
4% Monthly churn means that if you start 2019 with 1000 customers, you will have 610 customers left by December 31st. From revenue point of view, it means that if you were doing $10,000 MRR in January, you will only have $6100 MRR by end of the year.
Now that the formula for calculating churn is clear, let’s dive into what your monthly churn rate should be.
According to Bessemer Venture Partners, 5-7% Annual Churn Rate is acceptable, depending on whether you measure customers or revenue.
Did you get a little scared? Yes, me too. The 5-7% annual churn rate range is acceptable, but mostly for businesses focusing on enterprise or large business sales where customers are locked in with annual contracts and acquisition costs are high.
For small businesses, counting with month-to-month billing, fluctuation of customers and churn are much higher. Baremetrics open benchmark reports an average - 8.4% user churn based on an 800 business sample.
Also, they say the following:
A typical “good” churn rate for SaaS companies that target small businesses is 3-5% monthly. The larger the businesses you target, the lower your churn rate has to be as the market is smaller.
That is something less disturbing for me. Still, let’s look at some specific examples of companies like Buffer, Groove or ConnvertKit that share their data publicly.
Buffer
Based on Buffer’s publicly available data, we can see that it reports a 5.6% Monthly Churn (March 2019) which is 50% Annual Churn
Baremetrics
Baremetrics themselves report 5.8% monthly churn which is 51% annually.
Hubstaff
Hubstaff’s 2018 revenue churn rate was the same as Baremetrics’, 5.8% monthly or 51% annually.
ConvertKit
ConvertKit is also a SaaS in the SMB market and their reported 2018’s monthly user churn is 5.4% or 49%.
Launch27
Online booking software Launch27 reports a 6.5% Monthly Churn for 2018 (55% Annual Churn)
BugFender
BugFender is a cloud storage for app logs with 2018’s monthly churn rate 5% which is 46% annual churn rate.
Acceptable Churn rate for SMB SaaS
The data above indicates that a healthy SaaS selling to SMB should have their churn rate in the range of 5-6%. But we can’t assume that based on 6 companies. Multiple other SaaS Churn Rate studies have been conducted which might help to gain better perspective.
In 2013, Groove collected data from 712 SaaS businesses ranging from $1000 to $500,000 in MRR. The companies reported an average monthly churn rate of 3.2% which is 32.3% annual churn rate.
Compared to Baremetric’s open data, it’s slightly lower but still far away from the BVP’s reported 5-7% Annual churn rate.
Key Takeaways
- User/Revenue churn is bad and you should always work on improving it
- There’s a big difference between Monthly churn rate and Annual churn rate
- There’s also a big difference between user churn and revenue churn
- If you’re selling to SMB and your Monthly Churn is in the range of 3-5%, you should be fine. But, is fine enough?
Subscribe to SaaS Growth Hacker
Get the latest posts delivered right to your inbox
